

Runnin' to Dunkin'
Using Network Analysis to Determine the Optimal Location of Dunkin Donuts Stores
Instructor: Andres Sevtsuk
Teammates: Arjun Gupta Sarma, Marcus Mello, Cory Berg
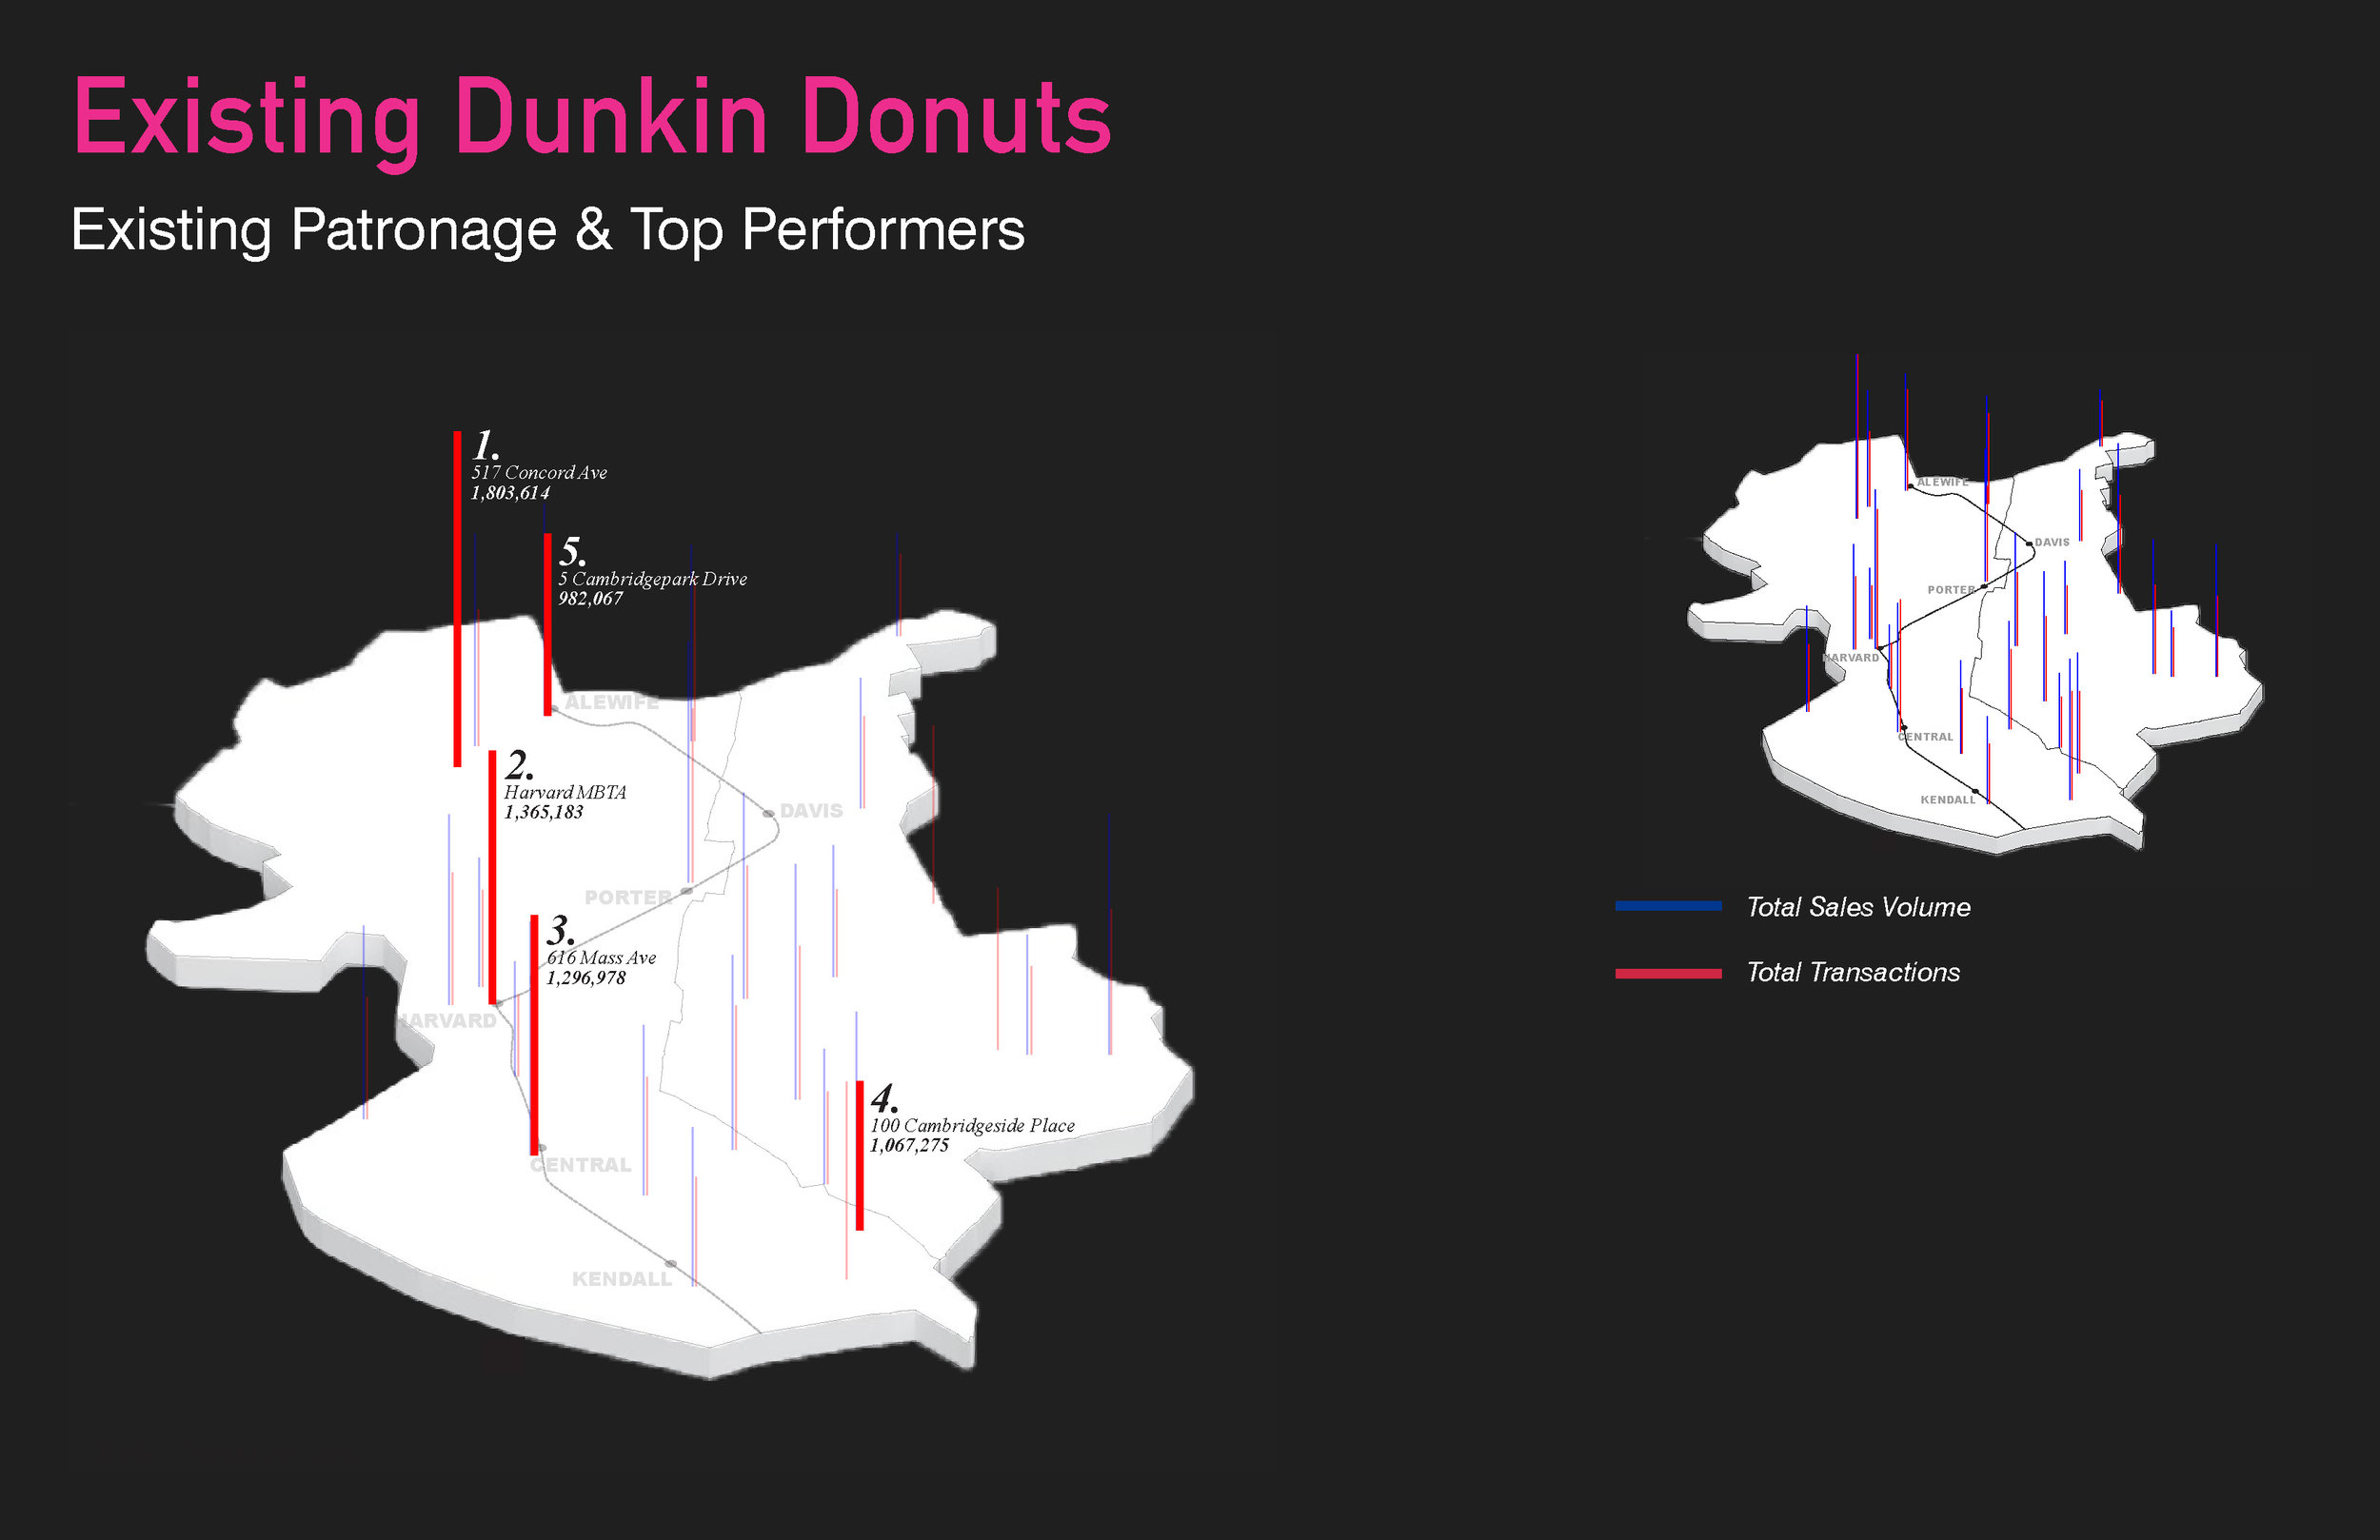
Modeling store patronage has often relied on static demand models, looking at the location of demand points (homes usually) in relation to stores. However, using network analysis, it is possible to come up with a more complex model of store patronage that takes into account the transactions that result from people passing stores on their way from home or work to somewhere else.
In this excercise, we use GIS Location Allocation Tool and Rhino Network Analysis to analyze existing patronage data for Dunking Donuts in the city of Cambridge, run a regression to see which factors are most important, and then use these factors to create a new aggregate demand model that takes into account demand from pedestrians passing by Dunkin Donuts stores. Then, we use GIS to determine, based on this new demand model, where the best location is for new stores that will capture more of this "in-betweenness demand".
Determining what factors influence store patronage

Spatial Variables that Might Explain Store Patronage
Employment

Gross Floor Area (Proxy for Density)

Cafes (Presence of Competing Stores)

Spatial Typologies of Stores


Creating a Distributed Demand Model
While some of the factors we tested could explain part of the patronage of different stores, it wouldn't capture the aspect of "betweenness", or which stores lie on routes between certain origins and destinations that customers might take. Because many purchases (especially at stores like Dunkin Donuts) are made enroute to somewhere else, modeling the total volume of pedestrians walking from certain origins to destinations could tell us what parts of the city have high volume of pedestrian passersby traffic. This "distributed demand" analysis was run using Rhino Network Analysis tool to distribute weight of certain origins along pedestrian routes in the city, and then these different types of demand were aggregated into one map of points, showing which parts of the city have higher volume of predicted pedestrian traffic than others.
Betweenness
In order to capture demand from pedestrians we ran "betweenness" analyses using Rhino Network Analysis Tool to give us a picture of which streets had the most pedestrian traffic.


